Decoding 2026 Corporate Earnings: Investor’s Guide to Key Metrics
Anúncios
Decoding 2026 Corporate Earnings Reports: Your Essential Guide for Savvy Investors
As we navigate the dynamic landscape of global finance, understanding and effectively interpreting corporate earnings reports remains paramount for any savvy investor. The year 2026 promises a unique set of economic conditions, technological advancements, and geopolitical influences that will undoubtedly shape the performance of companies worldwide. For those looking to make informed investment decisions, a deep dive into the intricacies of corporate earnings reports is not just recommended, but essential.
Anúncios
This comprehensive guide aims to equip you with the knowledge and tools necessary to dissect 2026 corporate earnings reports, focusing on the key metrics that truly matter. We’ll explore how to move beyond headline figures, identify underlying trends, and assess the long-term viability of your investments.
The Significance of Corporate Earnings Reports in 2026
Corporate earnings reports are much more than just a quarterly update; they are a direct reflection of a company’s financial health, operational efficiency, and strategic direction. In 2026, several factors will amplify their importance:
Anúncios
- Economic Volatility: Global economies are continually adjusting to post-pandemic realities, supply chain shifts, and evolving consumer behaviors. Earnings reports will provide crucial insights into how companies are adapting to these fluctuating conditions.
- Technological Disruption: The rapid pace of innovation, particularly in AI, automation, and sustainable technologies, means that companies’ abilities to integrate and leverage these advancements will be clearly visible in their financial performance.
- Regulatory Changes: New regulations concerning environmental, social, and governance (ESG) factors, data privacy, and market competition could significantly impact profitability and operational costs, all of which will be reflected in earnings.
- Geopolitical Landscape: International trade relations, regional conflicts, and policy shifts can create both opportunities and challenges. How companies navigate these complexities will be evident in their corporate earnings reports.
For investors, these reports offer an unparalleled opportunity to assess management’s effectiveness, evaluate competitive positioning, and forecast future growth potential. Ignoring them is akin to navigating a ship without a compass.
Understanding the Anatomy of a Corporate Earnings Report
Before diving into specific metrics, it’s crucial to understand the typical structure of a corporate earnings report. While formats can vary slightly, most reports include:
- Press Release: A concise summary of key financial highlights, often released before the full report. This is where you’ll find the headline numbers like revenue and EPS.
- Financial Statements: This is the core of the report, comprising three main statements:
- Income Statement (Profit & Loss): Shows a company’s revenues, expenses, and profit over a period (e.g., a quarter or year).
- Balance Sheet: Provides a snapshot of a company’s assets, liabilities, and owner’s equity at a specific point in time.
- Cash Flow Statement: Details how cash is generated and used by a company through its operating, investing, and financing activities.
- Management Discussion & Analysis (MD&A): This section offers management’s perspective on the company’s financial performance, significant events, risks, and future outlook. It’s often rich with qualitative insights.
- Notes to Financial Statements: Provides additional detail and context for the figures presented in the financial statements, including accounting policies, contingencies, and segment information.
Savvy investors don’t just skim the press release; they delve into each of these sections to gain a holistic understanding of the company’s performance and prospects. The ability to interpret these sections will be your superpower when analyzing 2026 corporate earnings reports.
Key Financial Metrics to Focus On in 2026 Corporate Earnings Reports
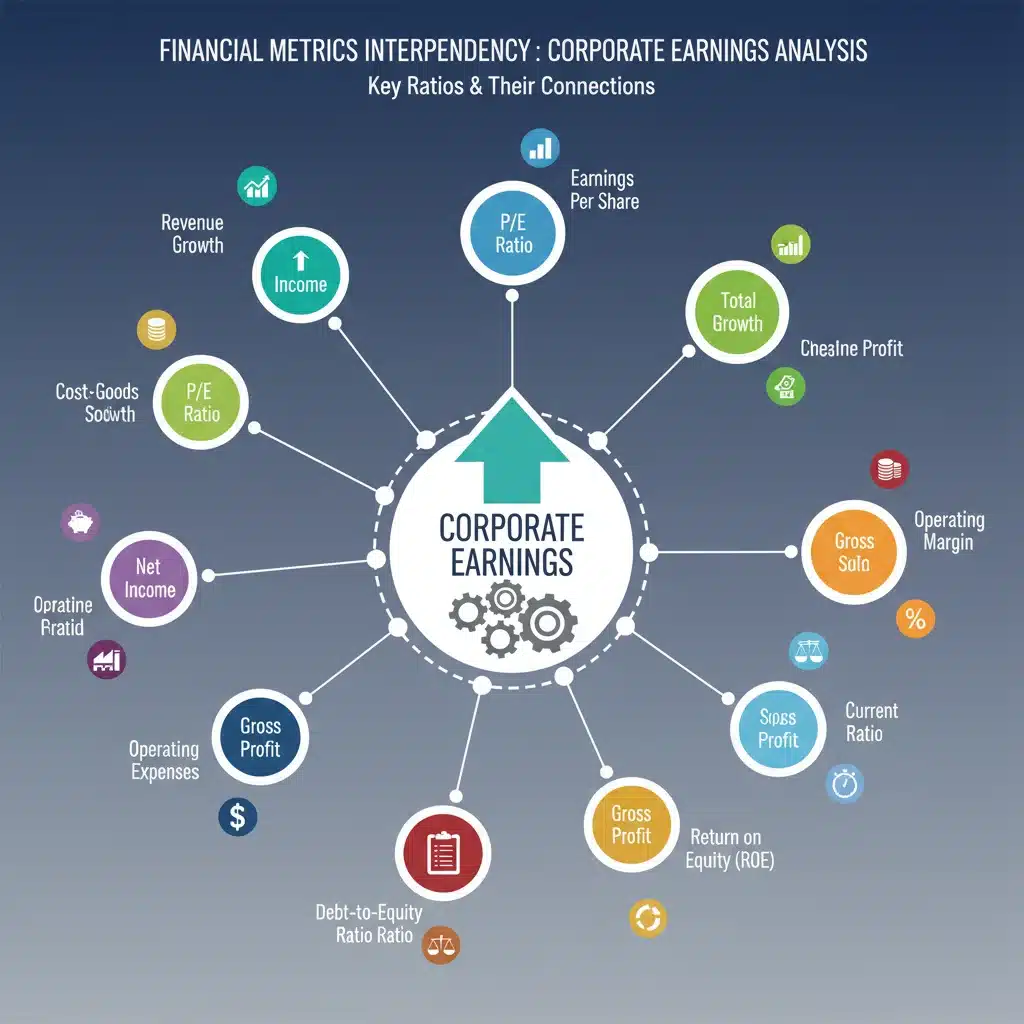
While numerous metrics can be extracted from corporate earnings reports, some are more critical than others for gauging a company’s health and potential. Here are the essential metrics you should be scrutinizing in 2026:
1. Earnings Per Share (EPS)
EPS is arguably the most widely cited metric. It represents the portion of a company’s profit allocated to each outstanding share of common stock. A higher EPS generally indicates greater value. When analyzing 2026 corporate earnings reports, pay attention to:
- Year-over-Year (YoY) Growth: Is EPS growing steadily?
- Analyst Estimates: Did the company beat, meet, or miss analyst expectations? A significant miss can lead to stock price volatility.
- Diluted vs. Basic EPS: Diluted EPS accounts for all potential shares that could be created (e.g., through stock options), offering a more conservative view.
- Non-GAAP Adjustments: Companies often report non-GAAP EPS, which excludes certain one-time or non-recurring expenses. While these can provide a clearer picture of operational performance, ensure you understand what has been excluded and why.
In 2026, companies facing higher interest rates or increased operational costs due to inflation may see their EPS impacted. Understanding the drivers behind EPS changes is crucial.
2. Revenue Growth
Revenue, or top-line growth, is a fundamental indicator of a company’s ability to generate sales. While profit is essential, sustained revenue growth often signals market acceptance of products/services and strong competitive positioning. For 2026 corporate earnings reports, consider:
- Growth Rate: Is revenue growing faster than the industry average? Is it accelerating or decelerating?
- Sources of Revenue: Is growth diversified across different product lines, geographies, or customer segments, or is it heavily reliant on one area?
- Organic vs. Acquired Growth: Distinguish between growth from existing operations (organic) and growth from mergers or acquisitions. Organic growth is often viewed more favorably.
Companies that can demonstrate robust revenue growth in innovative sectors (e.g., AI, renewable energy) will likely attract significant investor attention in 2026.
3. Profit Margins (Gross, Operating, Net)
Margins tell you how efficiently a company converts revenue into profit. They are vital for understanding a company’s cost structure and pricing power.
- Gross Profit Margin: (Gross Profit / Revenue) – Indicates how much profit a company makes after covering the direct costs of producing its goods/services.
- Operating Profit Margin: (Operating Income / Revenue) – Shows profitability after accounting for operating expenses (including COGS, SG&A, R&D). This is a good indicator of core business efficiency.
- Net Profit Margin: (Net Income / Revenue) – The ultimate measure of profitability, indicating how much profit a company keeps after all expenses, including taxes and interest.
Monitoring these margins in 2026 corporate earnings reports will be especially important as companies grapple with inflation, wage pressures, and supply chain optimizations. Declining margins can be a red flag, even if revenue is growing.
4. Cash Flow from Operations (CFO)
While profit is important, ‘cash is king.’ Cash flow from operations (CFO) reveals the cash generated by a company’s normal business activities. Unlike net income, which can be influenced by accounting accruals, CFO reflects the actual cash coming in and going out.
- Positive and Growing CFO: A healthy sign, indicating the company can fund its operations, investments, and debt obligations without relying on external financing.
- CFO vs. Net Income: Discrepancies between CFO and net income can signal accounting issues or significant non-cash expenses/revenues.
- Free Cash Flow (FCF): (CFO – Capital Expenditures) – This is the cash available to a company after funding its operations and maintaining its asset base. FCF is crucial for dividends, share buybacks, and debt reduction.
In 2026, with potential shifts in capital expenditure needs for technology upgrades or sustainability initiatives, robust CFO and FCF will be a strong indicator of a company’s financial resilience within corporate earnings reports.
5. Debt-to-Equity Ratio and Interest Coverage Ratio
These metrics from the balance sheet provide insights into a company’s financial leverage and its ability to service its debt, especially critical in a potentially rising interest rate environment.
- Debt-to-Equity Ratio: (Total Debt / Shareholder’s Equity) – Indicates the proportion of equity and debt used to finance a company’s assets. A high ratio might suggest higher risk.
- Interest Coverage Ratio: (EBIT / Interest Expense) – Measures a company’s ability to pay interest on its outstanding debt. A higher ratio indicates better financial health.
As central banks globally adjust monetary policies, the cost of borrowing could impact companies with significant debt. Scrutinizing these ratios in 2026 corporate earnings reports will help you identify companies at risk or those with prudent financial management.
6. Return on Equity (ROE) and Return on Assets (ROA)
These profitability ratios measure how effectively a company uses its equity and assets to generate profits.
- Return on Equity (ROE): (Net Income / Shareholder’s Equity) – Shows how much profit a company generates for each dollar of shareholder equity. A higher ROE is generally better.
- Return on Assets (ROA): (Net Income / Total Assets) – Indicates how efficiently a company uses its assets to generate earnings.
Both ROE and ROA are powerful indicators of management’s efficiency. Comparing these metrics against industry peers and historical performance within corporate earnings reports can reveal competitive advantages or inefficiencies.
7. Price-to-Earnings (P/E) Ratio
While not directly in the earnings report, the P/E ratio (Share Price / EPS) is a market valuation metric heavily influenced by earnings. It tells you how much investors are willing to pay per dollar of earnings.
- Comparative Analysis: Compare a company’s P/E to its industry average and historical P/E. A high P/E might indicate high growth expectations, while a low P/E could suggest undervaluation or investor skepticism.
- Forward P/E: Uses estimated future earnings, offering a forward-looking perspective.
In 2026, market sentiment and interest rate expectations will play a significant role in P/E ratios. Understanding how the market values earnings will be key to identifying reasonably priced investments.
Qualitative Factors to Consider in 2026 Corporate Earnings Reports
Beyond the numbers, the qualitative aspects of corporate earnings reports and accompanying calls offer invaluable context:
1. Management Commentary and Outlook
The MD&A section and the earnings call transcript provide direct insights into management’s perspective. Listen for:
- Future Guidance: What are management’s projections for future revenue, earnings, and capital expenditures? Changes in guidance can significantly impact stock prices.
- Strategic Initiatives: Are there new product launches, market expansions, or cost-cutting measures planned?
- Risk Factors: How does management perceive the biggest threats and opportunities facing the company in 2026?
- Tone: Is management confident, cautious, or concerned? The tone can reveal underlying sentiments not always apparent in the numbers.
In a rapidly evolving 2026 business environment, management’s ability to articulate a clear vision and strategy, and to adapt to challenges, will be a critical differentiator.
2. Industry Trends and Competitive Landscape
A company’s performance is always relative to its industry. When analyzing corporate earnings reports, consider:
- Market Share: Is the company gaining or losing market share?
- Competitive Response: How are competitors performing? Are there new entrants or disruptive technologies impacting the industry?
- Regulatory Environment: Are there upcoming regulations that could benefit or harm the company or industry?
Understanding the broader industry context will help you interpret a company’s individual performance more accurately, especially as industries undergo significant transformations in 2026.
3. ESG (Environmental, Social, Governance) Factors
In 2026, ESG considerations are no longer just ‘nice-to-haves’ but increasingly material to financial performance and investor perception. Look for:
- Sustainability Initiatives: How is the company addressing climate change, resource scarcity, and pollution?
- Social Impact: What are its policies on labor practices, diversity, equity, and community engagement?
- Governance Structure: Is there transparency in executive compensation, board independence, and shareholder rights?
Companies with strong ESG performance often demonstrate better long-term resilience and attract a growing pool of socially conscious investors. Their commitment to these factors will increasingly be woven into the narrative of their corporate earnings reports.

The Impact of 2026 Macroeconomic Factors on Corporate Earnings
The global economic climate in 2026 will be a complex tapestry of interconnected forces, and these macro factors will inevitably ripple through corporate earnings reports. Savvy investors must consider:
- Inflationary Pressures: Will inflation persist, leading to higher input costs and wage demands? Companies with strong pricing power or efficient supply chains will be better positioned.
- Interest Rates: The trajectory of interest rates will affect borrowing costs, consumer spending, and the valuation of growth stocks. Higher rates typically favor companies with strong balance sheets and consistent cash flows.
- Global Supply Chains: Continued efforts to diversify and localize supply chains could impact costs and efficiency. Companies with resilient supply chain strategies will report more stable earnings.
- Consumer Spending Trends: Shifts in consumer preferences, disposable income, and spending habits will directly influence revenue for consumer-facing businesses. The rise of new retail models and digital services will continue to shape this.
- Labor Market Dynamics: Wage growth and labor availability can significantly affect operational expenses and a company’s ability to scale. Automation and AI adoption may mitigate some of these pressures for certain industries.
- Technological Advancement Pace: Companies that are leaders in adopting and innovating with AI, quantum computing, and biotechnology could see significant competitive advantages reflected in their earnings. Conversely, those slow to adapt may face challenges.
- Energy Transition: The global push towards renewable energy will impact traditional energy sectors and create opportunities for companies involved in green technologies. This transition will be a recurring theme in many 2026 corporate earnings reports.
Integrating these macroeconomic insights with your analysis of individual corporate earnings reports will provide a more robust and nuanced investment thesis.
Strategies for Analyzing Corporate Earnings Reports in 2026
To effectively leverage corporate earnings reports, adopt a systematic approach:
- Pre-Earnings Research: Before the report drops, review recent news, analyst estimates, and the company’s previous guidance. Understand the key questions investors are asking.
- Focus on Trends, Not Just One-Offs: A single quarter’s results can be an anomaly. Look for consistent trends over several quarters and years. Compare current results to the previous quarter and the same quarter last year.
- Compare to Peers and Industry: Benchmark the company’s performance against its competitors and the broader industry. Is it outperforming or underperforming? Why?
- Listen to the Earnings Call: Management’s prepared remarks and Q&A session often provide crucial context and forward-looking statements that aren’t fully captured in the written report.
- Identify Red Flags and Green Lights:
- Red Flags: Declining margins, negative cash flow from operations, increasing debt, inventory buildup, restatements, significant non-recurring items, aggressive accounting practices, or frequent changes in management.
- Green Lights: Consistent revenue and EPS growth, strong cash flow, improving margins, prudent debt management, innovation, market share gains, and clear, achievable guidance.
- Adjust Your Investment Thesis: After thorough analysis, reassess your investment thesis. Does the report confirm your initial assumptions? Does it necessitate a change in your outlook or position?
Remember that investing is a long-term game. While corporate earnings reports provide valuable short-term data points, they should always be viewed within the context of a company’s long-term strategy and your personal investment goals.
The Role of Technology in Earnings Analysis for 2026
In 2026, technology will play an even more significant role in how investors access, process, and analyze corporate earnings reports. Expect advancements in:
- AI-Powered Analytics: Artificial intelligence and machine learning tools will become more sophisticated in sifting through vast amounts of data, identifying patterns, and even flagging anomalies in earnings reports faster than human analysts.
- Natural Language Processing (NLP): NLP will enhance the ability to extract key insights from management discussions, earnings call transcripts, and footnotes, helping investors quickly grasp qualitative information and sentiment.
- Real-time Data Feeds: Access to real-time financial data and news will become even more prevalent, allowing for quicker reactions to earnings releases.
- Predictive Modeling: Advanced algorithms will offer more accurate predictive models for future corporate performance, influenced by both micro and macroeconomic factors.
- Interactive Dashboards: Customizable dashboards will allow investors to visualize key metrics, compare companies, and track performance against industry benchmarks with greater ease.
While these technologies will streamline the analysis process, the human element of critical thinking, contextual understanding, and strategic decision-making based on corporate earnings reports will remain irreplaceable.
Conclusion: Mastering Corporate Earnings Reports for 2026 Success
As we look ahead to 2026, the ability to meticulously analyze and interpret corporate earnings reports will be a defining skill for successful investors. Moving beyond superficial headlines and delving into the quantitative and qualitative details will empower you to make more informed, confident, and ultimately, more profitable investment decisions.
By focusing on key metrics like EPS, revenue growth, profit margins, cash flow, and leverage ratios, and by considering the broader macroeconomic and industry landscapes, you can gain a significant edge. Couple this with an understanding of management’s strategic vision and the increasing importance of ESG factors, and you are well on your way to mastering the art of earnings analysis.
The financial world of 2026 will be complex and full of opportunities. Arm yourself with the insights from this guide, stay vigilant, and let the truth embedded within corporate earnings reports illuminate your path to investment success.